CarbonCRM Sales Dashboard
The CarbonCRM Sales Dashboard is a Dashboard View that sources data from your Warm Leads, Deals, and Activities boards to give a comprehensive, top-level breakdown of the sales pipeline we covered thus far.
How to use
This CarbonCRM Sales dashboard is really an open book as every company is going to have their own specific reporting for their own specific sales pipeline/process. There are hundreds of ways to display the information that the CarbonCRM collects from a new Lead to a Won Deal. The widgets allow you to select many different types of charts to display column-specific information from any board(s).
Feel free to get hands-on here with the widgets we initially provide and also create your own. Also, feel free to re-organize the dashboard when you are complete keeping in mind who is accessing it and on what devices. The widgets we initially provide cover a broad range of use cases so if you are lost, spend time studying how those widgets work.
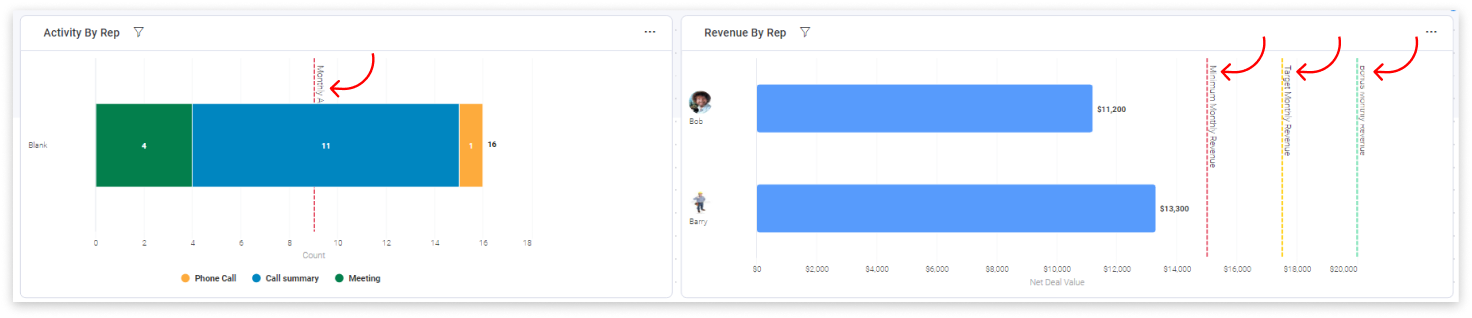
Lead/Deal/Contact-specific data is not the only thing we can report here. The Activities board is there to track all activities that occur within the Emails & Activities on any board in the CarbonCRM. The dashboard can then give you reports on rep activity for either Deals or Leads (or both!).
Activities Board
The Activities Board does not have its own section in this guide because it really serves as a background tool/services and is not something that should be modified unless you have a solid understanding of how the board works. The Activities Board feeds data back to the CarbonCRM Sales Dashboard, to display the actions and activities of your team.
Let us know if you have any further questions about this board by emailing us at support@carbonweb.co.
Recommended Customizations
Use benchmarks:
Utilize the benchmark feature already built into monday to hold your team accountable to monthly, quarterly, or yearly goals.
Benchmarks can be set for both financial and activity-based reporting.
Create additional groups/statuses
Sometimes limiting the information accessible on the general sales board can be a good thing.
Also allows you to silo information if the single dashboard is getting overloaded.
Silo by individual Reps’ sales data/activity and overall sales data/activity reporting.
Repurpose specific dashboard(s) to be viewed on mobile or tablets.
This could be helpful for accessing information away from your desktop/laptop.
Use the contract expiry date/deal due date:
monday.com dashboards are a pretty open book between the widgets provided and 3rd party developers pushing apps out there.
Over time as you collect more data into your CRM, feel free to add/remove/update any existing widget to your liking.